Have You Been Robbed on the Last Mile of Sales?
It is a fair question, whether you are the seller or the customer. OK, so what is the last mile of sales? I didn't find an official definition, so I'm borrowing the concept from "the last mile of finance" between balance sheet and 10-k, and the "last mile of telecommunications" that is the copper wire from the common carrier's substation to your home or business. Let's call the last mile of sales
that part of the sales funnel in which prospects are ready to become customers, or are already customers, ready for up-selling and cross-selling.
Survey Participants were robbed on the Last Mile of Sales!
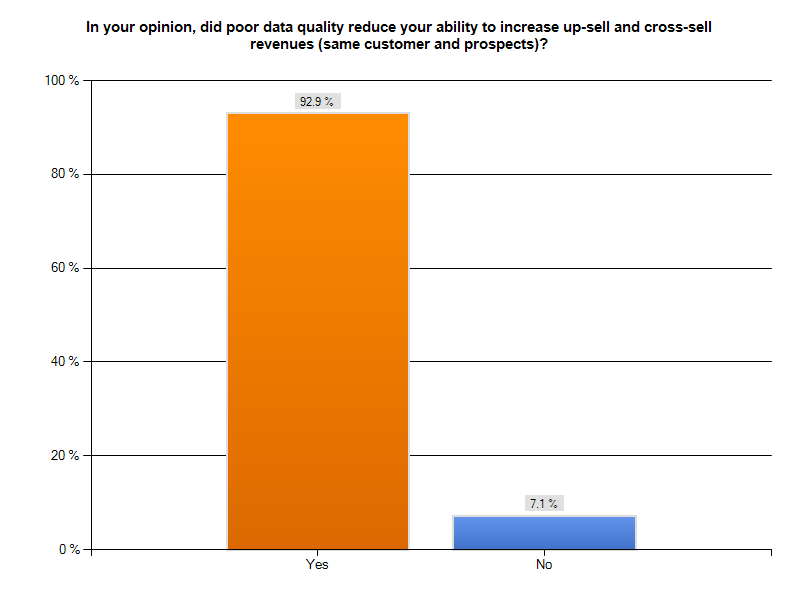
This Tuesday morning, I looked at our "Poor Data Quality - Negative Business Outcomes" survey results and I noticed a surprising agreement among participants in one sales-related area. 126 respondents, or over 90%of those responding to our question about poor data quality compromising up-selling and cross-selling, indicated they had such a problem. The graph following gives you a sense of how large a percentage of respondents had lost sales opportunities.
This is a troubling statistic. Organizations spend huge sums on marketing programs designed to attract prospects and nurture them to become customers. Beyond direct monetary investment, ensuring a successful trip down the sales funnel takes time, effort, and ability. From the perspective of the seller, failing to sell more products and services to an  existing (presumably happy) client is like being robbed on the last mile of sales. Your organization has already succeeded in making a first sale. Subsequent selling should be easier, not harder. From the perspective of the buyer, losing confidence in your chosen vendor because they fail to know you and your preferences, confuse you with similarly named customers, or display inept record-keeping about their last contact with you, robs you of a relationship you had invested time and money in developing. Perhaps now your go-to vendor becomes your former vendor, and you must spend time seeking an alternate source. Once confidence has been shaken, it is difficult to rebuild.
What did the survey say?
How is it possible that more than 90% of our respondents to this question lost an opportunity to up-sell or cross-sell? The next chart tells the story. It is poor data quality, plain and simple. 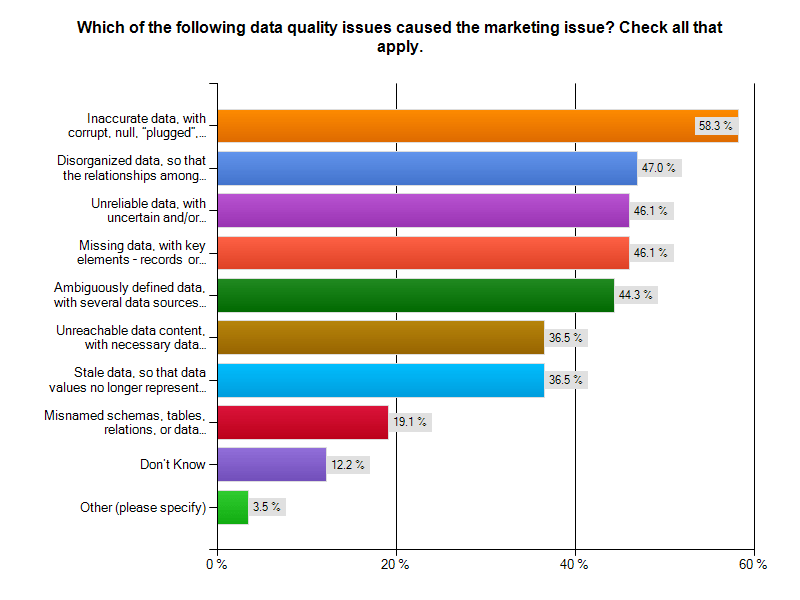 You can read the results yourself. As a sales prospect for a lead generation service, I had a recent experience with at least one of the top four poor data quality problems.
Oops, the status wasn't updated after our last call
In the closing months of 2013, I was solicited by a lead generation firm. I asked them to contact me in the first quarter of 2014. Ten days into 2014, they called again. OK, perhaps a bit early in the quarter, but they are eager for my business. With no immediate need, I asked them to call me again in Q3-2014 to see how things were evolving. So, I was surprised when I received another call from that firm, yesterday. Had we traveled through a time-warp? Was it now mid-summer? A look out the window at the snowstorm in progress suggested it was still February 2014. The caller was the same person as last time, and began an identical spiel. I interrupted and mentioned we had only spoken a week earlier. The caller appeared to remember and agree, indicating that there was no status update about the previous call. Was this sloppy ball-handling by sales, an IT technology issue, an ill-timed database restore? Was this a 1:1,000,000 chance or an everyday occurrence? The answer to all of those questions is "I have no idea, but I don't want to trust these folks with managing my lead generation campaign". If they can't handle their own sales process, how are they going to help me with mine? What ever the cause of the gaff, they robbed themselves of a prospect, and me of any confidence I might have had in them.
The Bottom Line
Being robbed on the last mile of sales by poor data quality is unnecessary, but all too common. Have you recently been robbed on the last mile of sales? Are you a seller, or a disappointed prospect or customer? Cal Braunstein of The Robert Frances Group and I would like to hear from you. Please do contact me to set up an appointment for a conversation. Whether you have already participated in our survey, are a member of the InfoGov community, or simply have an enlightening experience about how poor data quality caused you to have a negative business outcome, reach out and let us know.
Published by permission of Stuart Selip, Principal Consulting LLC
The Butterfly Effect of Bad Data (Part 2)
Last time... Bad Data was revealed to be pervasive and costly In the first part of this two-part post, I wrote about the truly abysmal business outcomes our survey respondents reported in our "Poor Data Quality - Negative Business Outcomes" survey. Read about it here. In writing part 1, I was stunned by the following statistic: 95% of those suffering supply chain issues noted reduced or lost savings that might have been attained from better supply chain integration. The lost savings were large, with 15% reporting missed savings of up to 20%! In this post, I'll have a look at supply chains, and how passing bad data among participants harms participants and stakeholders, and how this can cause a "butterfly effect".
Supply Chains spread the social disease of bad data
A supply chain is a community of "consenting" organizations that pass data across and among themselves to facilitate business functions such as sales, purchase ordering, inventory management, order fulfillment, and the like. The intention is that executing these business functions properly will benefit the end consumer, and all the supply chain participants.
In case the Human Social Disease Analogy is not clear...
Human social diseases spread like wildfire among communities of consenting participants. In my college days, the news that someone contracted a social disease was met with chuckles, winks, and a trip to the infirmary for a shot of penicillin. Once, a business analogy to those long-past days might have been learning that the 9-track tape you sent to a business partner had the wrong blocking factor, was encoded in ASCII instead of EBCDIC, or contained yesterday's transactions instead of today's. All of those problems were easily fixed. Just like getting a shot of penicillin. Today, we live in a different world. As we learned with AIDS, a social disease can have pervasive and devastating results for individuals and society. With a communicable disease, the inoculant has its "bad data" encoded in DNA. Where supply chains are concerned, the social disease inoculant is likely to be an XML-encoded transaction sent from one supply chain participant to another. In this case, the "bad transaction" information about the customer, product, quantity, price, terms, due date, or other critical information will simply be wrong, causing a ripple of negative consequences across the supply chain. That ripple is the Butterfly Effect.
The BUTTERFLY EFFECT
The basis of the Butterfly Effect is that a small, apparently random input to an interconnected system (like a supply chain) may have a ripple effect, the ultimate impact of which cannot be reasonably anticipated. As the phrase was constructed by Philip Merilees in back in 1972...
Does the flap of a butterfly’s wings in Brazil set off a tornado in Texas?According to Martin Christopher, in his 2005 E-Book "Logistics and Supply Chain Management", the butterfly can and will upset the supply chain.
Today's supply chains are underpinned by the exchange of information between all the entities and levels that comprise the complete end-to-end [supply chain] network... The so-called "Bullwhip" effect is the manifestation of the way that demand signals can be considerably distorted as a result of multiple steps in the chain. As a result of this distortion, the data that is used as input to planning and forecasting activities can be flawed and hence forecast accuracy is reduced and more costs are incurred. (Emphasis provided)
Supply Chains Have Learned that Bad Data is a Social Disease
Supply chains connect a network of organizations that collaborate to create and distribute a product to its consumers. Specifically, Investopedia defines a supply chain as:
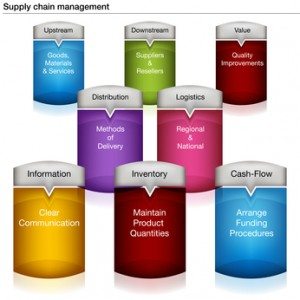
The network created amongst different companies producing, handling and/or distributing a specific product. Specifically, the supply chain encompasses the steps it takes to get a good or service from the supplier to the customerManaging the supply chain involves exchanges of data among participants. It is easy to see that exchanging bad data would disrupt the chain, adding cost, delay, and risk of ultimate delivery failure to the supply chain mix. With sufficient bad data, the value delivered by a managed supply chain would come at a higher cost and risk. Consider the graphic of supply chain management and the problems our survey respondents found in their experiences with supply chains and bad data. Click on the graphics to see them in full size.
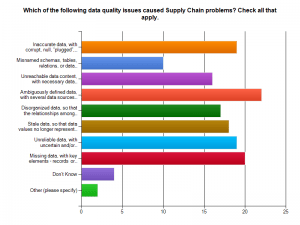
Bad data means ambiguously defined data, missing data, and inaccurate data with corrupt or plugged values. These issues lead the list of supply chain data problems found by our survey respondents.
Would you be pleased to purchase a new car delivered with parts that do not work or break because suppliers misinterpreted part specifications? Do you remember the old 1960 era Fords whose doors let snow inside because of their poor fit? Let's not pillory Ford, as GM and Chrysler had their own quality meltdowns too. Supply chain-derived quality issues like these kill revenues and harm consumers and brands.
Would you like to drive the automobile that contained safety components ordered with missing and corrupt data? What about that artificial knee replacement you were considering? Suppose the specifications for your medical device implant had been ambiguously defined and then misinterpreted. Ready to go ahead with that surgery? Bad data is a social disease, and it could make you suffer!
Bad Data is an Expensive Supply Chain Social Disease
Bad data is costing supply chain participants big money. As the graphic from our survey indicates, more than 20% of respondents to the Supply Chain survey segment thought that data quality problems added between 6% and 10 %. to the cost of operating their supply chain. Almost 16% said data quality problems added between 11% and 20% to supply chain operating costs. That is HUGE! The graphic following gives you survey results. Notice that 44% of the respondents could not monetize their supply chain data problems. That is a serious finding, in and of itself. 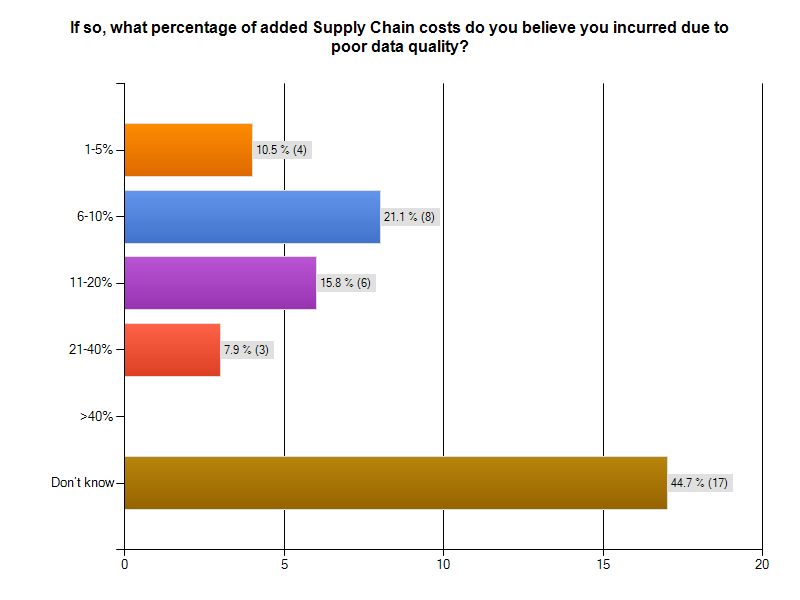
THOUGHT EXPERIMENT: CUT SUPPLY CHAIN MANAGEMENT COSTS by 20%
Over 15% of survey respondents with supply chain issues believed bad data added between 11% and 20% to the cost of operating their supply chain.Let's use 20% in our thought experiment, to yield a nice round number.
Understanding the total cost of managing a supply chain is a non-trivial exercise. Industry body The Supply Chain Council has defined The Supply Chain Operations Reference (SCOR®) model. According to that reference model, Supply Chain Management Costs include the costs to plan, source, and deliver products and services. The costs of making products and handling returns are captured in other aggregations.
For a manufacturing firm with a billion dollar revenue stream, the total costs of managing a supply chain will be around 20% of revenue, or $200,000,000 USD. Reducing this cost by 20% would mean an annual saving $40,000,000 USD. That would be a significant savings, for a data cleanup and quality sustenance investment of perhaps $3,000,000. The clean-up investment would be a one-time expense. If the $40,000,000 were a one time savings, the ROI would be 1,3333%.
But wait, it is better than that. The $40,000,000 savings recurs annually. The payback period is measured in months. The ROI is enormous. Having clean data pays big dividends!
If you think the one-time "get it right and keep it right" investment would be more like $10,000,000 USD, your payback period would still be measured in months, not years. Let's add a 20% additional cost or $2,000,000 USD in years 2-5 for maintenance and additional quality work. That means you would have spent $18,000,000 USD in 5 years to achieve a savings $200,000,000. That would be greater than a 10-times return on your money! Not too shabby an investment, and your partners and stakeholders would be saving money too. This scenario is really a win-win situation, right down the line to your customers.
The Corcardia Group believes that total supply chain costs for hospitals approach 50% of the hospital's operating budget. For a hospital with a $60,000,000 USD annual operating budget, a 20% savings means $12,000,000 USD would be freed for other uses, like curing patients and preventing illness.
Even Better...
For manufacturers, hospitals, and other supply chain participants, ridding themselves of bad data will produce still better returns. By cleaning up the data throughout the supply chain, it is likely that costs would go down while margins would improve. The product costs for participants could drop. Firms might realize an additional 5% cost savings from this as well. Their return is even better.What does the Supply Chain Community say about Data Quality?
A 2011 McKinsey & Company study entitled McKinsey on Supply Chain: Selected Publications, which you can download here, the publication "The Challenges Ahead for Supply Chains" by Trish Gyorey, Matt Jochim, and Sabina Norton goes right to the heart of a supply chain's dependency on data, and the weakness of current supply chain decision-making based on that data. According to the authors:
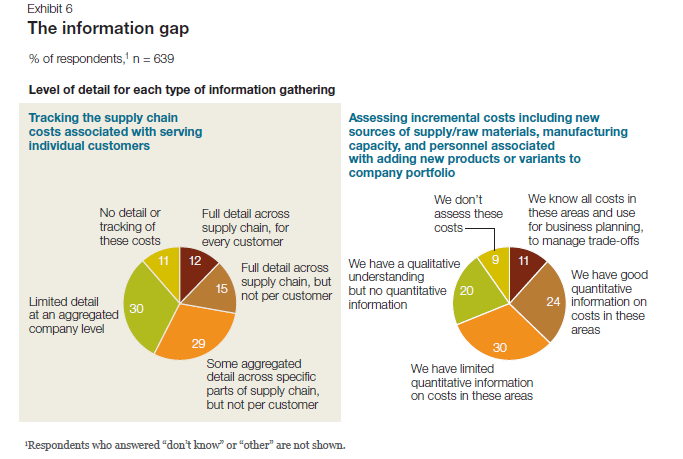
Knowledge is power The results show a similar disconnection between data and decision making: companies seem to collect and use much less detailed information than our experience suggests is prudent in making astute supply chain decisions (Exhibit 6). For example, customer service is becoming a higher priority,and executives say their companies balance service and cost to serve effectively... Half of the executives say their companies have limited or no quantitative information about incremental costs for raw materials, manufacturing capacity, and personnel, and 41 percent do not track per-customer supply chain costs at any useful level of detail.Here is Exhibit 6 - a graphic from their study, referenced in the previous quote. Andrew White, writing about master data management for the Supply Chain Quarterly in its Q2-2013 issue, underscored the importance of data quality and consistency for supply chain participants.
... there is a growing emphasis among many organizations on knowing their customers' needs. More than this, organizations are seeking to influence the behavior of customers and prospects, guiding customers' purchasing decisions toward their own products and services and away from those of competitors. This change in focus is leading to a greater demand for and reliance on consistent data.White's take-away from this is...
...as companies' growing focus on collaboration with trading partners and their need to improve business outcomes, data consistency—especially between trading partners—is increasingly a prerequisite for improved and competitive supply chain performance. As data quality and consistency become increasingly important factors in supply chain performance, companies that want to catch up with the innovators will have to pay closer attention to master data management. That may require supply chain managers to change the way they think about and utilize data.Did everyone get that? Data Quality and Consistency are important factors in supply chain performance. You want your auto and your artificial knee joint to work properly and consistently, as their designers and builders intended. This means curing existing data social disease victims and preventing the recurrence and spread.
The Bottom Line
At this point, nearly 300 respondents have begun their surveys, and more than 200 have completed them. I urge those who have left their surveys in mid-course to complete them!
Bad data is a social disease that harms supply chain participants and stakeholders. Do take a stand on wiping it out. The simplest first step is to make your experiences known to us by visiting the IBM InfoGovernance site and taking our "Poor Data Quality - Negative Business Outcomes" survey.
When you get to the question about participating in an interview, answer "YES"and give us real examples of problems, solutions attempted, success attained, and failures sustained. Only by publicizing the magnitude and pervasiveness of this social disease will we collectively stand a chance of achieving cure and prevention.
As a follow-up next step, work with us to survey your organization in a private study that parallels our public InfoGovernance study. The public study forms a excellent baseline for us to compare and contrast the specific data quality issues within your organization. Data Quality will not be attained and sustained until your management understands the depth and breadth of the problem and its cost to your organization's bottom line.
Contact me here and let us help you build the business case for eliminating the causes of bad data. Published by permission of Stuart Selip, Principal Consulting LLC
Bad Data is a Social Disease (Part 1)
Organizational bad data is a social disease easily passed to your business partners and stakeholders With 200 completed responses in our "Poor Data Quality - Negative Business Outcomes" survey, run in conjunction with The Robert Frances Group, the IBM InfoGovernance Community, and Chaordix, it is safe to say that bad data is a social disease that can spread easily and quickly. Merriam-Webster defines a social disease as
a disease (as tuberculosis) whose incidence is directly related to social and economic factorsOK, that definition works for the bad data social disease. In this case, the social and economic factors enabling and potentiating this disease include
- Business management failing to fund and support data governance initiatives
- IT management failing to sell the value of data quality to their business colleagues,
- Business partners failing to challenge and push-back when bad data is exchanged
- Financial analysts not downgrading firms that repeatedly refile 10-Ks due to bad data
- Customers not abandoning firms that err due to bad data quality and management
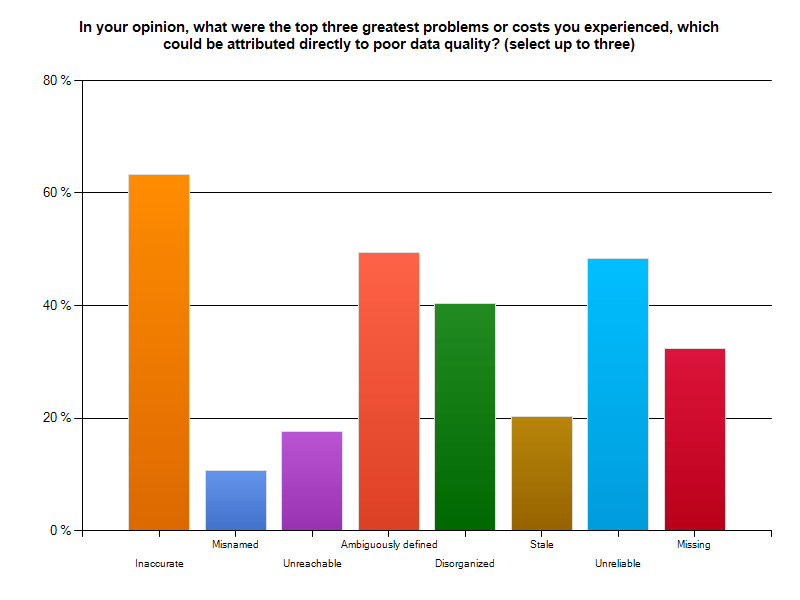 Social diseases negatively affect the sufferer, their partners, and the community around them. According to our respondents:
- 95% of those suffering supply chain issues noted reduced or lost savings that might have been attained from better supply chain integration.
- 72% reported customer data problems, and 71% of those respondents lost business because the didn't know their customer
- 71% of those suffering financial reporting problems said poor data quality cause them to reach and act upon erroneous conclusions based upon materially faulty revenues, expenses, and/or liabilities
- 66% missed the chance to accelerate receivables collection
- 49% reported operations problems from bad data, and 87% of those respondents suffered excess costs for business operations
- 27% reported strategic planning problems, with 75% of those indicating challenges with financial records, profits and losses of units, taxes paid, capital, true customer profiles, overhead allocations, marginal costs, shareholders, etc.)
What is in Part 2?
In next week's post, we'll examine some of our survey results specific to bad data and the supply chain. A successful supply chain requires sound internal data integration and equally sound data exchange and integration across chain participants.A network of willing participants exchanging data is fertile ground for spreading the social disease of business. Expect a thought experiment about wringing the bad data quality costs out of supply chain management, and see what some supply chain experts think about the dependency of effective supply chains on high quality data.
The Bottom Line
Believe that bad data is a social disease and take a stand on wiping it out. The simplest first step is to make your experiences known to us by visiting the IBM InfoGovernance site and taking our "Poor Data Quality - Negative Business Outcomes" survey. When you get to the question about participating in an interview, answer "YES"and give us real examples of problems, solutions attempted, success attained, and failures sustained. Only by publicizing the magnitude and pervasiveness of this social disease will we collectively stand a chance of achieving cure and prevention. As a follow-up next step, work with us to survey your organization in a private study that parallels our public InfoGovernance study. The public study forms an excellent baseline for us to compare the specific data quality issues within your organization. You will not attain and sustain data quality until your management understands the depth and breadth of the problem and its cost to your organization's bottom line. Bad Data is a needless and costly social disease of business. Let's move forward swiftly and decisively to wipe it out!
Published by permission of Stuart Selip, Principal Consulting LLC
System Dynamics is now for the rest of us!
by Stu Selip, Principal Consulting
That's great, but what is it? According to the System Dynamics Society
System dynamics is a computer-aided approach to policy analysis and design. It applies to dynamic problems arising in complex social, managerial, economic, or ecological systems -- literally any dynamic systems characterized by interdependence, mutual interaction, information feedback, and circular causalitySo, System Dynamics (SD) uses computers to simulate dynamic systems that are familiar to us in the realms of business and technology. OK that sounds great, but why am I writing about SD? A presentation by ViaSim Solution's (ViaSim) president J. Chris White and his ViaSim colleague Robert Sholtes at last Friday's InfoGov Community call piqued my interest, and I think SD will pique your interest too.
What do the big guys do with SD?
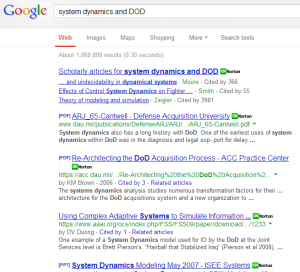 Chris and Robert mentioned the long-time application of SD in the Department of Defense (DOD). A quick Google search revealed widespread use ranging from scholarly articles about simulating the control behavior of fighter planes to pragmatic approaches to re-architecting the acquisition process of the DOD itself. It looks like the DOD appreciates System Dynamics. Here is a clip from that search. Large enterprises can make good use of SD too. In a 2008 Harvard Business Review (HBR) article entitled Mastering the Management System by Robert S. Kaplan and David P. Norton, the authors identify the concept of closed loop management systems in linking strategy with operations, informed by feedback from operational results.
Various studies done in the past 25 years indicate that 60% to 80% of companies fall short of the success predicted from their new strategies. By creating a closed-loop management system, companies can avoid such shortfalls.Their article, which you can see here with the right HBR subscription, discusses how this might be done, without explicitly mentioning System Dynamics.
What about the rest of us?
Most of the rest of us are involved in more mundane tasks than articulating corporate strategy. Many of us work on planning IT projects, with plans defined in Microsoft Project (MSP). How many MSP users have solid training in the tool? I'll wager that many practitioners have learned MSP by the "seat of their pants", never quite understanding why a small change to the options of a project plan has produced dramatically different timelines, or why subtle changes cause plans to oscillate between wildly optimistic, and depressingly pessimistic. 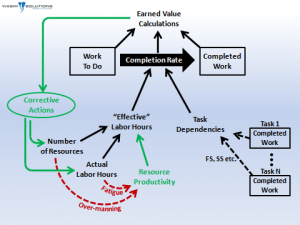 The ViaSim team spoke directly to these points by introducing us to pmBLOX, an SD-empowered MSP-like project planning tool that addresses MSP issues that cause us to lose confidence and lose heart. In this graphic, developed by ViaSim, the black arrows indicate inputs normally available to MSP users. The key differences are shown in the green and red arrows. With pmBLOX, project planners may specify corrective actions like adding workers to projects that are challenged. In addition, project planners can account for project delivery inefficiencies resulting from fatigue, or excessive staffing. You can watch Chris explain this himself, right here. At last, we will be able to respect Brook's Law, the central thesis of which is "adding manpower to a late software project makes it later". Dr. Fred Brooks expanded on this at length in The Mythical Man-Month, published by Addison Wesley in 1975. When I asked Chris about his experience with the challenges of mythical man-month project planning and non-SD project planning solutions he told me
As we often see in the real world, sometimes "throwing people" at the problem puts the project further behind schedule. With these real-world corrective actions and productivity impacts, pmBLOX provides a framework for creating realistic and achievable plans. The biggest risk for any project is to start with an unrealistic baseline, which is often the case with many of today's simple (yet popular) project planning tools.
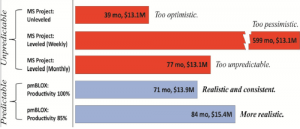 Here is an example of the output of MSP and the output of pmBLOX for an actual DOD project. You can see how a minor change in an MSP setting (leveling) made some dramatic and scary changes in the project plan. Notice that the output of pmBLOX looks much more realistic and stable with respect to project plan changes.
What about the learning curve for pmBLOX?
There is good news here. pmBLOX designers adopted the MSP paradigm and allow for direct importing of existing MSP-based plans. Here is an example of how pmBLOX looks, and how it depicts the difference between its plan and the one suggested by MSP. To my eye, the interface is familiar, so adopting and transitioning to pmBLOX should not be very difficult.


